Here are three case studies to illustrate our data mining process: one from the Walker Lane in the Western USA; one from the Porcupine Camp in Eastern Canada; and one from the Lachlan Fold Belt in Eastern Australia. These studies range from Archean lode gold to Ordovician porphyry gold to Tertiary volcanic-hosted gold deposits, and from regional to mining camp scales.
These examples are all related to gold exploration. However, the BWM targeting process can be applied to a wide range of ore deposit types and geological environments. Our process can also be readily extended to 3-D or 4-D underground situations.
Publications
Further information can be found in a number of scientific papers that we have had published.
western USA
Walker Lane
The Walker Lane shear zone straddles the border between Nevada and California and has a long history of exploration and mining, dating back to the discovery of the famous Comstock Lode in the late 1850s. The Walker Lane is notable for its numerous occurrences of volcanic-hosted epithermal gold and silver deposits.
The majority of gold deposits occur in the Walker Lane shear zone, which is a 100-km wide, NW-trending structural corridor extending southeast from Reno towards Las Vegas. This strike-slip system contains a series of deep-seated, right-lateral shears and associated normal faults. The rock outcrop is mostly Tertiary volcanics with an assortment of Mesozoic intrusions of mostly monzonitic or granodioritic composition. The basement is made up of strongly folded and thrusted Palaeozoic sedimentary rocks.
The area covered by the Walker Lane study is about 140,000 square kilometres. To date, approximately 50 million ounces of gold have been discovered in this area. Our data mining study was commissioned by Newmont Mining Corporation as part of a regional survey for gold in this area. The available exploration data sets included regional geology and structure, airborne magnetics and radiometrics, isostatic residual gravity, stream sediment geochemistry, Landsat and digital elevation. Most of these data sets were obtained from sources such as the Nevada Bureau of Mines and the National Geophysical Data Center. One exception was regional structure which was based on a proprietary in-house compilation belonging to Newmont.
The known deposits layer is the most critical, since it is used for training the process against all the other data sets. In producing this layer, all known gold deposits exceeding 50,000 ounces were carefully plotted from air photographs, detailed publications, or field visits with a GPS.
Data Mining Results
Since the Walker Lane is a competitive exploration area, the final target map is too sensitive to be shown in full. Part of the study area falling inside the Nevada Test Site, however, can be shown. After four decades of nuclear weapons testing, this is permanently off-limits to gold mining.
The figures below show an area of about 2500 square km in the northwest corner of the Test Site, with the geology on the left and the TM on the right. The target favorability map in the middle is based on all the exploration data sets except for geochemistry, which was not collected in the Test Site.
The study produced two interesting targets. Target A coincides with a color anomaly in the TM data, indicating the presence of alteration associated with mineralization. Target B coincides with a circular feature in both the TM and the geology. Further interest is added by the small, orange-colored formation labeled `Ta3′, which outcrops at the center of this probable caldera. This is a Tertiary andesite well known to Nevada geologists for hosting many of the larger volcanic-hosted gold deposits in the Great Basin. Both of these targets would certainly be followed up if access were permitted to this area.

Geology map

Target map
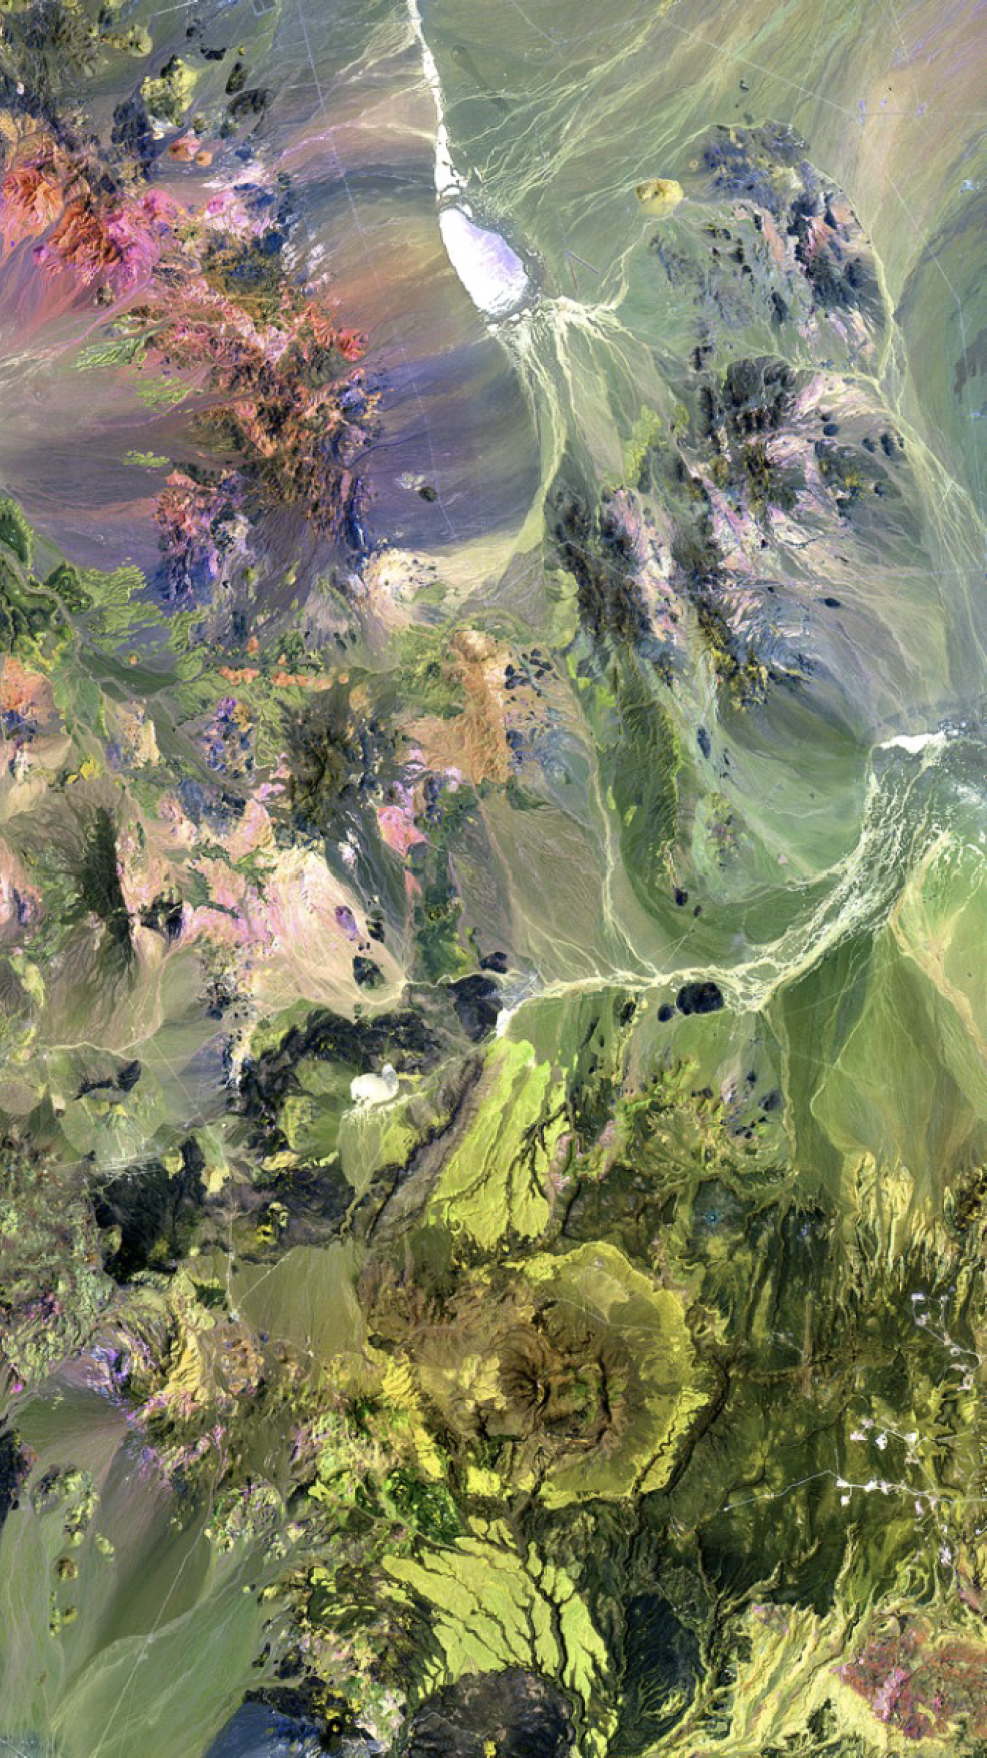
Landsat image
eastern canada
Porcupine Camp
The Porcupine Gold Camp in Eastern Canada is one of the most prolific gold mining districts in North America, with past production exceeding 60 million ounces of gold. Mining and exploration have been going on in this district since gold was first discovered near Timmins in 1907.
The Abitibi greenstone belt, which contains the Porcupine Camp, is the largest greenstone belt in the world. The major gold camps are spatially associated with steeply dipping shear zones, such as the Destor-Porcupine Fault. It has a high proportion of supracrustal rocks, a generally low metamorphic grade, and contains a wide variety of mineral deposits.
The Porcupine study covers roughly 8,000 square kilometers, which is a much smaller area than the other two case studies. At the time of the study the Porcupine Joint Venture (PJV) was a joint venture between Placer Dome and Kinross Gold Corporation, who were actively exploring for more gold. The available exploration data sets included geology and structure, high quality airborne magnetics and gravity, SRTM data, and a Geotem survey. In addition, the footprints of all the known gold deposits in the Porcupine camp were carefully established by PJV staff.
Data Mining Results
The Porcupine Gold Camp is well-suited to this type of objective analysis. The accompanying figures show a closeup of the results obtained in one part of the camp. The left figure shows the geology, and the right figure shows our corresponding target map. The green crosses mark known deposits, and the red crosses mark targets having a greater than one-in-four chance of containing a gold deposit, according to the study. The blue circles mark prior drill holes which have been analyzed for lithogeochemistry and gold concentration.
A valuable test was conducted by Dr. Cliff Saunders, an independent consultant working for Kinross Gold Corporation. He selected a number of sites from the data mining target map, at some of which the process predicted gold, and at others where it predicted there should be no gold. With the help of the PJV geological staff, he examined the drill logs and other geological information from these locations.
At four sites where the process predicted gold, two were found to contain economic gold deposits. The other two did not contain economic gold, but the geologists felt both were good places to look. At four sites where the process predicted no gold, one contained a small gold deposit. At each of the other three sites, extensive drilling had encountered no gold, as predicted.
Apart from the one miss of a small economic deposit, and the couple of sites that were considered prospective by the process but were deemed unfavorable by the geologists, the data mining process gave very good results. In particular, it achieved better than the predicted one-in-four success rate for the occurrence of economic gold.

Geology map

Target map
eastern australia
Lachlan Fold Belt
New South Wales has a history of exploration going back over 150 years. The announcement of a discovery near Bathurst in 1851 sparked a gold rush, and many other discoveries were made. None of these, however, was on a grand scale. The Lachlan Fold Belt (LFB) was consequently somewhat overlooked by mineral explorers until the discovery of a large base metal deposit at Woodlawn in 1972, followed by the rich gold-copper deposits at Cadia in 1992.
The Lachlan Fold Belt forms a small portion of the Tasman Fold Belt, stretching from Queensland to Tasmania. In the eastern part of the belt, Ordovician-Silurian volcanoes and intrusions were formed during the Palaeozoic Era in a north-south trending island arc setting, known as the Macquarie Arc. The Ordovician and Silurian rocks which outcrop in the LFB study area consist of deep water sediments interspersed with intermediate to mafic volcanics, and intruded by shoshonitic intrusions. The best gold and copper mineralization, for example at Cadia, appears to be closely associated with Ordovician monzonites.
The gold endowment of the study area, which covered some 120,000 square kilometres, is close to 50 million ounces. However, within the greater Lachlan Fold Belt, which runs into Victoria, the total endowment is over 150 million ounces. The data mining study was carried out on our own initiative, but has subsequently been licensed to Inflection Resources Ltd.
The exploration data sets used in the LFB study consisted of geology and structure, gravity, magnetics, radiometrics, geochemistry, Landsat and terrain. Footprints of as many known gold deposits as possible were established using the nationwide OZMIN database, compiled and maintained by Geoscience Australia, as well as by reviewing publications and company reports.
Data Mining Results
The process worked well in the LFB, where there is a first-class collection of modern data sets and a fine selection of known deposits. A strong, coherent statistical signal was obtained from the exploration data as a whole.
Like the Walker Lane, the Lachlan Fold Belt is an active exploration area, so we can’t show the overall target map that resulted from the data mining process. However, we can show a small portion of the map. The accompanying figures show a pair of typical neural network targets, marked as Target A and Target B in the figure below. Target A in the north is actually a small known deposit, which was used as part of the training set. The white squares are on a 100m grid, and represent the footprint of the known gold mineralization. The mine shaft symbols represent old workings which produced minor amounts of gold.
The larger Target B in the south is sharply defined and covers an area of roughly two square kilometres. A target like this would normally be quickly staked and followed up on the ground. Unfortunately, as can be seen in the satellite image below, this target lies directly under the small country town of Forbes, which happens to be where gold was first discovered by the prospector “German Harry” Stephens in June 1861.

Target map

Satellite image